Our software
Note
On this page you will find the software that we are developing.
PanAbyss
![]()
Description: PanAbyss is a tool to manipulate and visualize pangenomes variation graphs. It is based on a graph database modelisation (Neo4j) created from a pangenome graph (GFA file) and annotation files (GFF or GTF).
It allows, from a GFA file and annotation files (GFF or GTF) to link annotations to the pangenome, and then: (1) compute shared regions between a set of selected haplotypes, (2) compute the sequences of a selected region, (3) compute a global phylogenetic tree or a local phylogenetic tree from a selected region (neighbour joining with a distance matrix based on Jaccard index), and (4) visualize a region and annotation of the pangenome.
Availability: PanAbyss is available on INRAE Forge.
Pan1c
![]()
Description: Pan1c is a Snakemake workflow that simplifies the creation of pangenomes by focusing on the comparison of similar chromosomes, using either PGGB or Minigraph-Cactus. A pangenome graph is first generated individually for each chromosome, and then these chromosome-scale pangenomes are concatenated into a final graph. This approach reduces construction time through parallelization and facilitates interpretation as well as downstream analyses. Throughout the process, various graphs and statistics are produced to help users assess the quality of the pangenome graph and interpret the results. All these visualizations and statistics are accessible via a web page generated by Pan1c-view.
Availability: Pan1c is available on INRAE Forge.
snoBoard
![]()
Description: The snoBoard database compiles ribosomal RNA (rRNA) modifications, box C/D and box H/ACA snoRNA guides sequences for a number of species including Saccharomyces cerevisiae (Sc), Human (Hs), the plant Arabidopsis thaliana (At) and tomato Solanum lycopersicum (Sl). Mapped modifications are 2’-O methylation, pseudouridylation and other known modifications when available. The user interface allows the access to rRNA targets, mapped modifications and snoRNA guides under different views. Modifications can be accessed through a table (one line per modification), or mapped on their target RNA sequences and secondary structures. A comparative view allows to access to mapped sites conserved between a selected subset of species. Using the comparative view, it is possible to interrogate and visualize the conservation of target nucleotides sequences and modified sites. Information on modifications targets and snoRNA guides can be accessed by organism, snoRNA guide family and modification type.
Availability: Snoboard can be accessed online at snoboard.org. The source code is available on INRAE Forge.
ASTERICS
![]()
Description: ASTERICS is A Tool for the ExploRation and Integration of omiCS data. It is a web application that aims at making complex exploratory and integration analysis workflows easily available to biologists. Edition, Exploration and Integration menus organize the interface to perform data edition, missing value imputation, normalization, data exploration with interactive plots, numerical summaries, PCA, tests, clustering, self-organizing maps, and data integration with various methods. This project has been funded by Région Occitanie (Grant number 20008788).
Availability: ASTERICS can be accessed online at this link and its user documentation (including two case studies) can be accessed here. The source code and its complete installation instruction (using docker images) is available on INRAE Forge.
Publication: Maigné, É., Noirot, C., Henry, J., Adu Kesewaah, Y., Badin, L., Déjean, S., Guilmineau, C., Krebs, A., Mathevet, F., Segalini, A., Thomassin, L., Colongo, D., Gaspin, C., Liaubet, L., and Vialaneix, N. (2023). Asterics: A simple tool for the ExploRation and Integration of omiCS data. BMC Bioinformatics 24, 391. https://doi.org/10.1186/s12859-023-05504-9.
MetagWGS
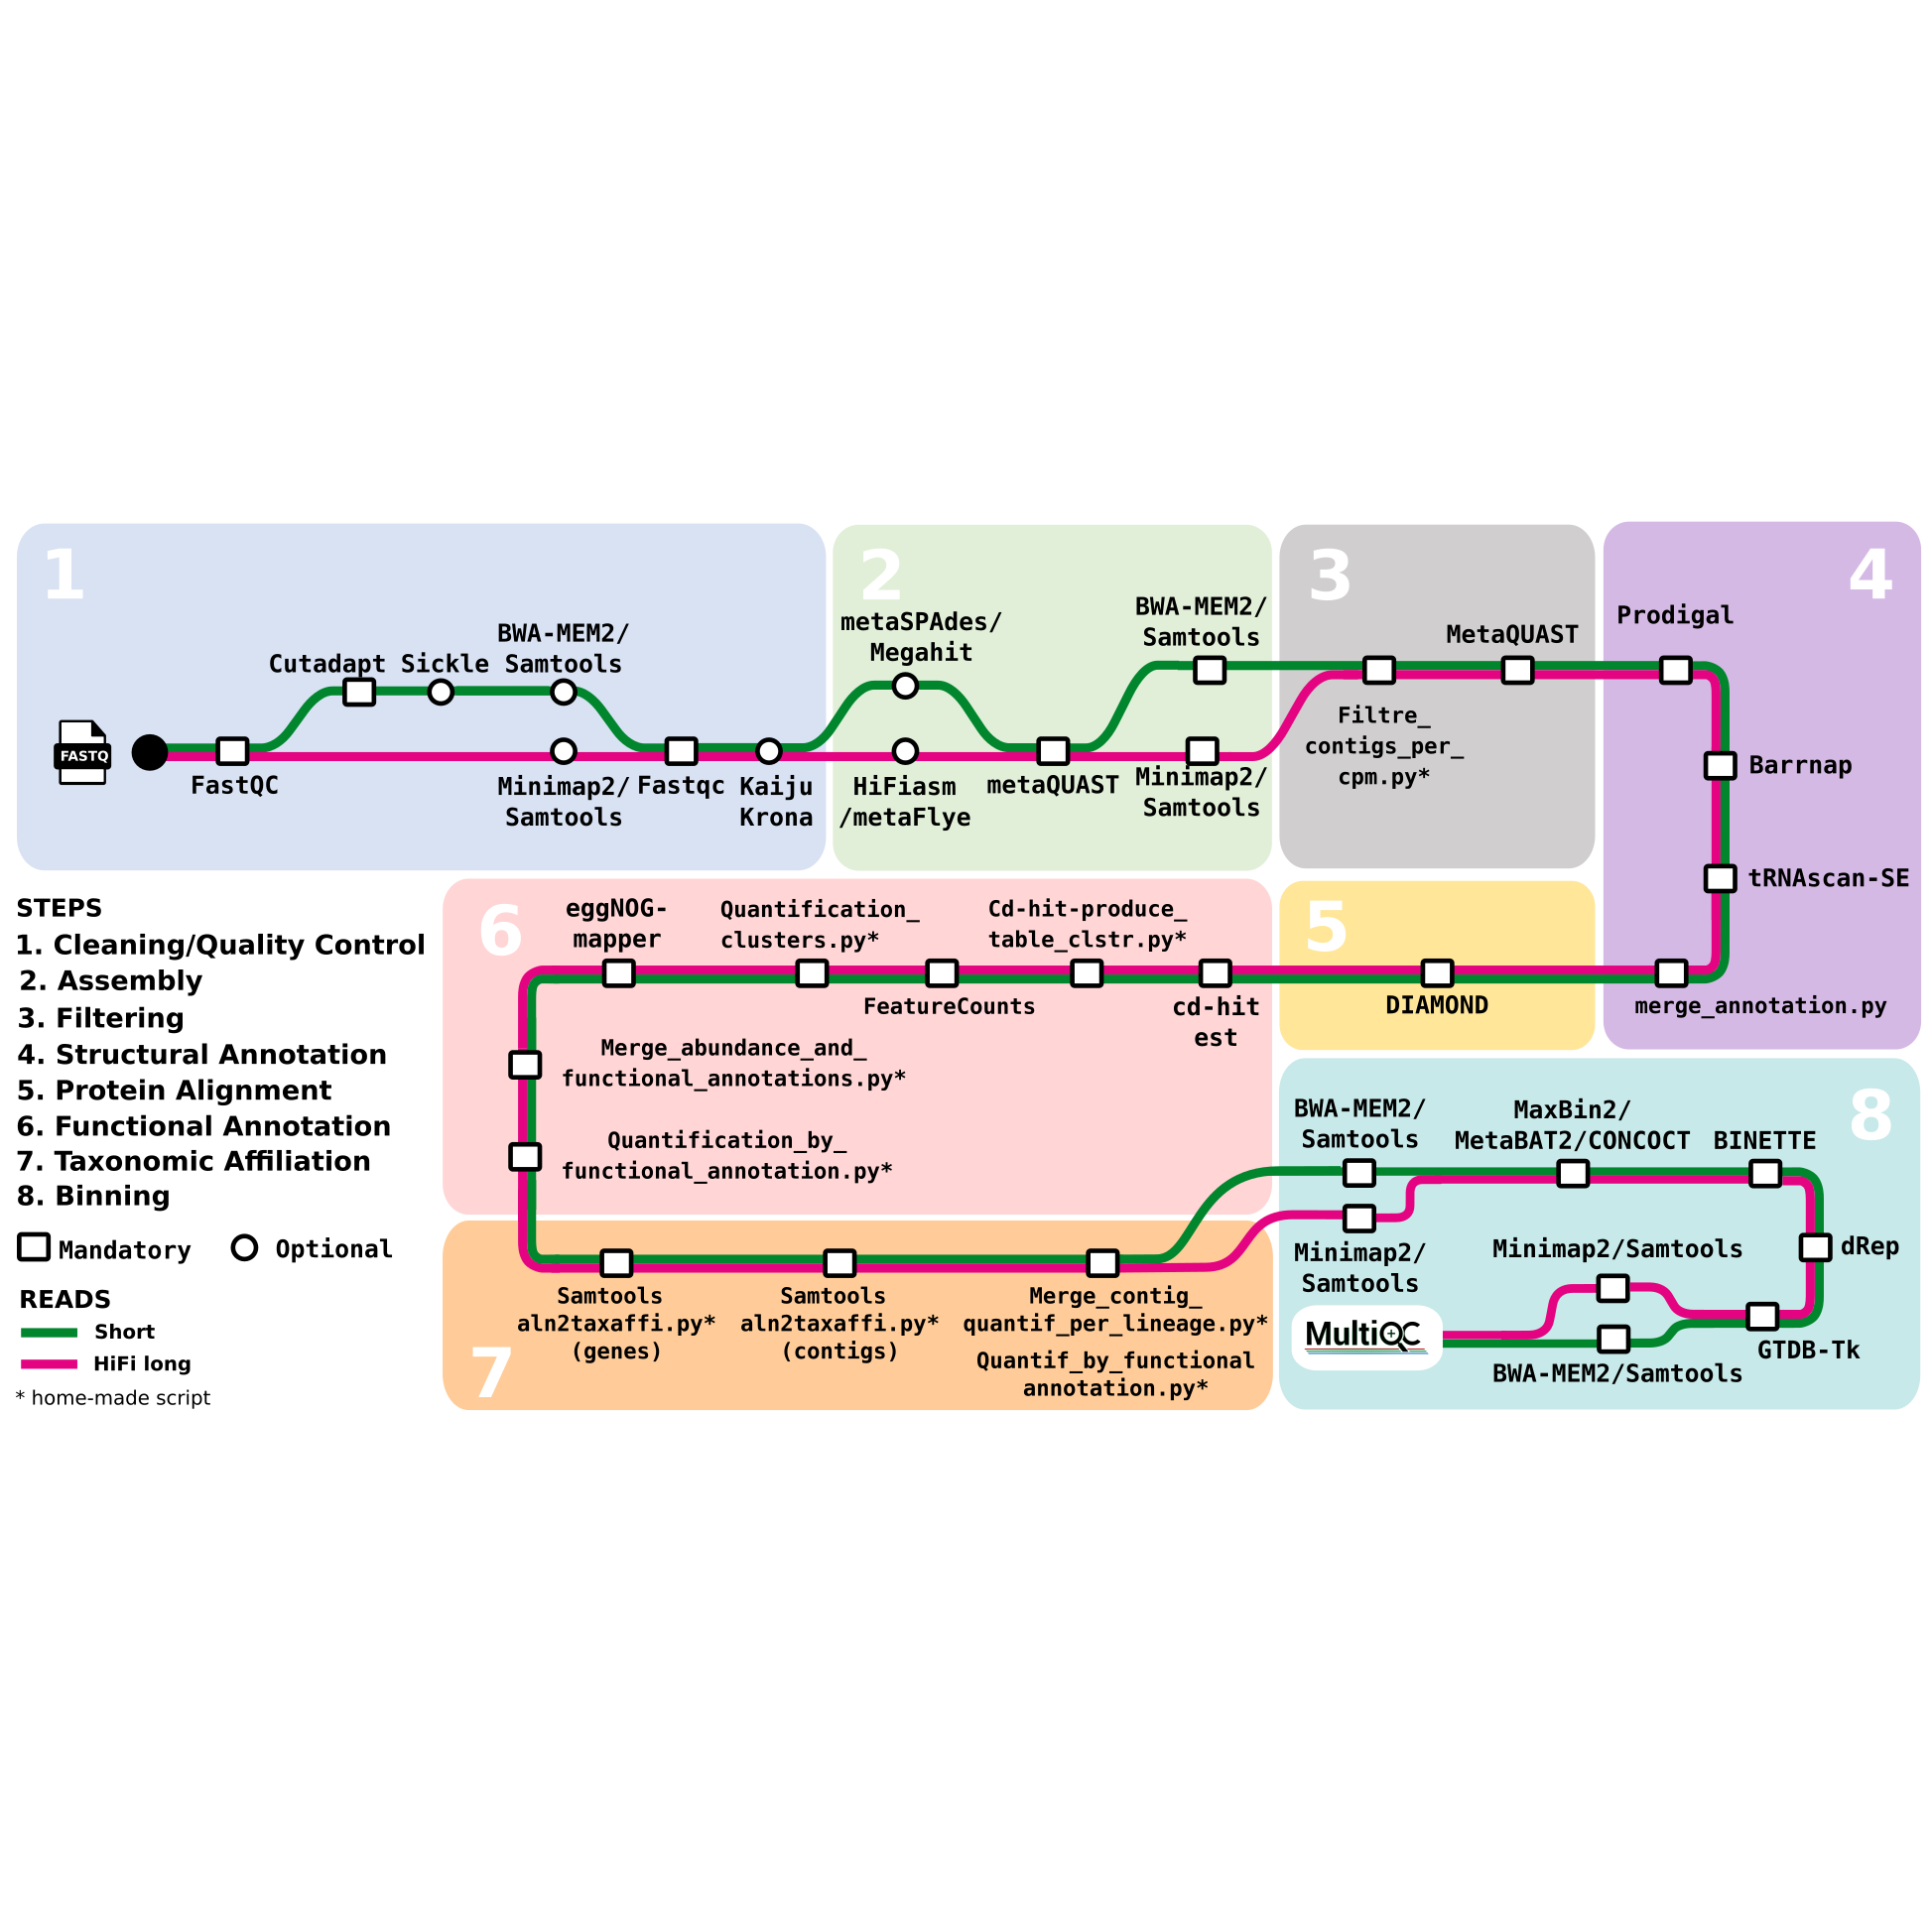
Description: metagWGS is a workflow dedicated to the analysis of metagenomic data. It allows assembly, taxonomic annotation, and functional annotation of predicted genes. Since release 2.3, binning step with the possibility of cross-alignment is included. It has been developed in collaboration with several CATI BIOS4biol agents. Funded by Antiselfish Project (Labex Ecofect), ExpoMicoPig project (France Futur elevage) and SeqOccIn project (CPER – Occitanie Toulouse / FEDER), ATB_Biofilm funded by PNREST Anses, France genomique (ANR-10-INBS-09-08) and Resalab Ouest.
Availability: The source code and its complete documentation is available on INRAE Forge
D-GENIES : Dot plot large GENomes in an interactive, efficient and simple way
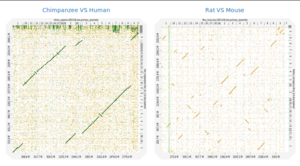
Description: Dot plots are widely used to quickly compare sequence sets. They provide a synthetic similarity overview, highlighting repetitions, breaks and inversions. Different tools have been developed to easily generated genomic alignment dot plots, but they are often limited in the input sequence size. D-GENIES is a standalone and WEB application performing large genome alignments using minimap2 software package and generating interactive dot plots. It enables users to sort query sequences along the reference, zoom in the plot and download several image, alignment or sequence files. D-GENIES is an easy to install open source software package (GPL) developed in Python and JavaScript.
Availability: The source code is available on Github and it can be tested at Genotoul-bioinfo instance.
Publication: Cabanettes, F., and Klopp, C. (2018). D-GENIES: Dot plot large genomes in an interactive, efficient and simple way. PeerJ 6, e4958. https://doi.org/10.7717/peerj.4958.
mixKernel
Maintained only
This software is in maintenance only mode. Don't expect new feature
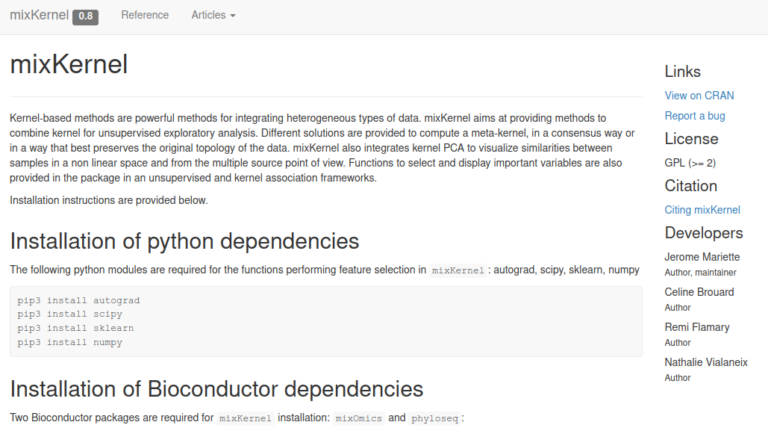
Description: Kernel-based methods are powerful methods for integrating heterogeneous types of data. mixKernel provides methods to combine multiple kernels for unsupervised exploratory analysis or to select features in a kernel for unsupervised analysis or kernel-output prediction. For the multiple kernel problem, different solutions have been implemented to obtain a consensus kernel or a kernel that best preserves the original topology of the data. mixKernel also integrates kernel PCA to visualize similarities between samples in a nonlinear space and from the multiple source point of view. Functions to assess and display important variables using permutations are also provided in the package.
Availability: mixKernel is available on CRAN and information are provided on its website. It is fully compatible with the mixOmics package and a tutorial describing the approach can be found on mixOmics web site.
Publications:
- Mariette, J., and Vialaneix, N. (2018). Unsupervised multiple kernel learning for heterogeneous data integration. Bioinformatics 34, 1009–1015. https://doi.org/10.1093/bioinformatics/btx682.
- Brouard, C., Mariette, J., Flamary, R., and Vialaneix, N. (2022). Feature selection for kernel methods in systems biology. NAR Genomics and Bioinformatics 4, lqac014. https://doi.org/10.1093/nargab/lqac014.